
Table of Content
Updated March 30, 2026
The B200 rental market is no longer hypothetical. As of March 30, 2026, the SDB200RT index, Silicon Data's standardized benchmark for B200 cloud GPU pricing, stood at an index value of 5.48 in the supplied daily series. The index peaked at 6.11 on March 25 and was 6.08 on March 28; it opened 2026 at 4.40 and set a year-to-date low of 4.29 on January 11. Even after the late-month pullback, the series ended March 24.4% above its January 1 level.
Across all data sources
March mean$5.09/hr | March median$4.96/hr | 10th–90th band$4.56–$6.05 | Observed full range$4.40–$6.11 |
|---|---|---|---|
Feb → Mar change+12.8% | January mean$4.41/hr | February mean$4.52/hr | |
B200 Index Trend Through 2026: March Was the Inflection Point
The supplied B200 index series shows a two-speed first quarter. January was mostly rangebound around the mid-4.4s, February improved briefly but finished nearly flat, and March delivered the decisive re-rating. From January 1 to March 30, the index rose from 4.40 to 5.48, with the year-to-date low set at 4.29 on January 11 and the year-to-date high of 6.11 reached on March 25.
Observation 1: The floor rose. The ultra-cheap listings that pulled the index down in early January didn't persist. Once those introductory and spot-priced offers were absorbed or withdrawn, the observed price floor climbed from roughly $2.25 to the $2.50–$3.00 band and stayed there — mechanically lifting the index even before any top-end movement.
Observation 2: The IQR compressed upward. Through January and February, the interquartile range sat comfortably between ~$3 and ~$5. By late March the entire band shifted up, with q25 climbing faster than q75. That means the cheap-to-mid tier repriced, not just the premium end.
Observation 3: The spread blew out, not just the mean. The min-max band widened dramatically in late March. A handful of providers held steady while others repriced aggressively — the ceiling spiked past $8 while the floor barely moved. That growing gap signals fragmentation: the market was no longer moving as one.
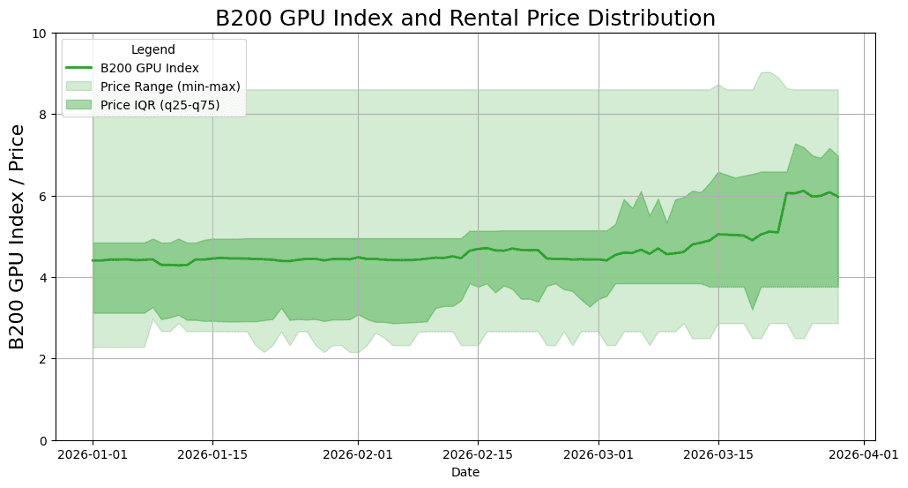
Exhibit. B200 GPU index and rental price distribution, January-March 2026.
Viewed month by month, March is the standout. January finished almost unchanged (+0.7%), February gave back a modest 1.2%, and March advanced 23.6% from start to finish. That step-up is what transformed the quarter from a rangebound opening into a clear late-March repricing.
Month | Start | End | Low | High | Change |
|---|---|---|---|---|---|
Jan | 4.40 | 4.43 | 4.29 | 4.47 | +0.03 (+0.7%) |
Feb | 4.48 | 4.43 | 4.41 | 4.71 | -0.05 (-1.2%) |
Mar | 4.43 | 5.48 | 4.40 | 6.11 | +1.05 (+23.6%) |
March also contained the sharpest internal momentum shift. The index crossed 4.5 on March 3, 5.0 on March 15, and 6.0 on March 23. The first half of March averaged 4.66, versus 5.53 in the second half, and the single largest daily jump was the 0.96-point increase on March 23.
Driver 1: HBM3e cost pass-through. Samsung and SK Hynix raised HBM3e contract prices by ~20% for 2026 deliveries, and NVIDIA itself revised hardware MSRPs upward in late February, citing memory component costs. Those input-cost increases flowed into cloud hourly rates with a 4–6 week lag, landing squarely in March.
Driver 2: GTC repriced expectations. NVIDIA's GTC conference (March 13–20) triggered a wave of new enterprise commitments and next-gen Rubin announcements. Providers with existing B200 inventory had less reason to discount when the demand signal from hyperscalers was this strong — so mid-tier listings repriced upward around the event.
Driver 3: An unprecedented wave of frontier model releases consumed spare capacity. February–March 2026 saw more major launches than any comparable period in AI history — Claude Opus 4.6 and Sonnet 4.6 in early-to-mid February, GPT-5.3 Codex and then GPT-5.4 in early March, Gemini 3.1 Pro, Grok 4.20, Qwen 3.5, MiniMax M2.5, ByteDance Seed 2.0, and GLM-5 all within the same window. Each new frontier model drives a burst of training, fine-tuning, and evaluation demand. Providers that had idle B200 nodes suddenly had paying tenants, removing the supply slack that had kept mid-range pricing soft.
Driver 4: Agentic inference changed the demand profile. Token generation volumes went exponential as agentic AI workflows — multi-step reasoning, tool-calling chains, parallel agent spawning — became production workloads rather than demos. Unlike batch training, inference demand is persistent and latency-sensitive, which favors on-demand pricing over spot. That structural shift pushed utilization rates up and spot availability down, tightening the spread from the bottom.
B200 Index VS. H100 Index on March: A Tale of Two Markets
With B200 supply ramping through Q1 and the H100 market now well-established, March 2026 offered a clean window to compare rental economics across GPU generations. We tracked three daily indices throughout the month: the B200 index, the H100 Hyperscaler index, and the H100 Neocloud index (SDH100RT).
The GPU rental market in March 2026 told two very different stories depending on which chip you were watching. The H100 — now roughly two years into its commercial lifecycle — traded in tight, predictable bands on both the Hyperscaler and Neocloud indices. The B200, by contrast, was anything but predictable: it started the month near $4.40/hr, spent two weeks climbing gradually, then spiked above $6.00/hr in the final week before pulling back on the last day.
Daily price trend
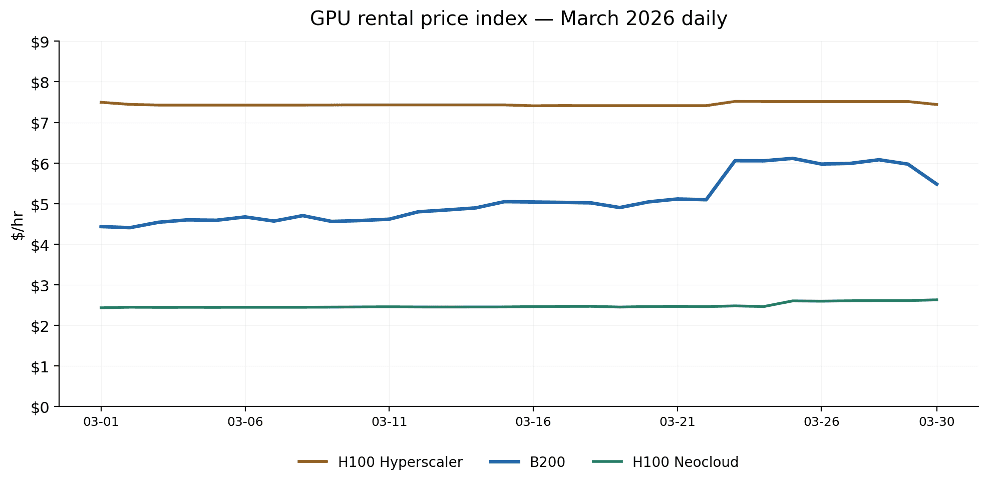
Exhibit. B200 vs H100 GPU rental price index, daily March 2026.
The daily chart makes the pricing hierarchy immediately clear. H100 Hyperscaler held a nearly flat line around $7.43–$7.52/hr all month — a mature, liquid market with stable supply commitments. H100 Neocloud was equally flat at $2.43–$2.63/hr, reflecting the competitive pressure among smaller providers racing to fill capacity.
B200 was more volatile. It drifted upward from $4.40/hr at the start of the month, crossed the $5.00/hr mark around March 15, then jumped sharply to the $6.00/hr range from March 23–29 before dropping back to $5.48/hr on March 30. The shape of the B200 curve — gradual climb followed by a step-change — suggests a supply constraint hitting mid-month rather than a smooth demand-driven repricing.
It is also worth noting the gap between the three indices. H100 Hyperscaler commands a 3.0x premium over H100 Neocloud, reflecting the difference between enterprise-grade SLAs and bare-metal neocloud offerings. B200, based on Neocloud quotes, at $5.09/hr mean sits closer to the Hyperscaler end on a performance-per-dollar basis, though the comparison is complicated by Blackwell's higher throughput per GPU.
Re-referenced price movement
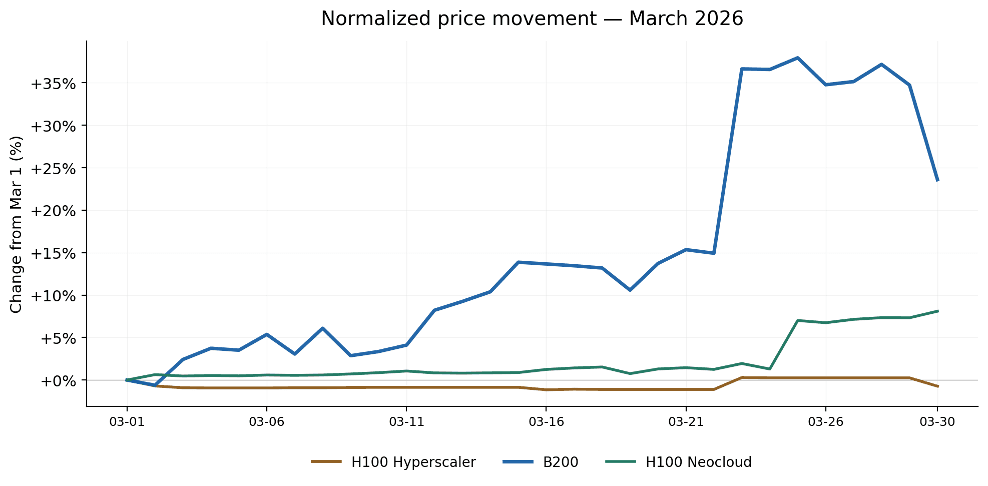
Exhibit. Normalized price movement from March 1, B200 vs H100.
Re-referencing all three indices to their March 1 value strips away the absolute price difference and focuses on relative movement. The result is striking: by month-end, B200 had gained roughly +24% from its opening price, while H100 Neocloud moved +8% and H100 Hyperscaler was essentially flat at –1%.
Two patterns stand out. First, B200's gains were non-linear — the index spent the first three weeks grinding upward by roughly +15%, then added another +10% in a single multi-day jump around March 23. This suggests a discrete event (likely a supply shock or a large buyer entering the market) rather than steady organic demand growth.
Second, the two H100 indices barely moved in percentage terms, even during the window when B200 was surging. This decoupling is important: it tells us the late-March price action was B200-specific, not a broad GPU market rally. Whatever drove B200 pricing higher did not spill over into H100 demand.
Volatility comparison
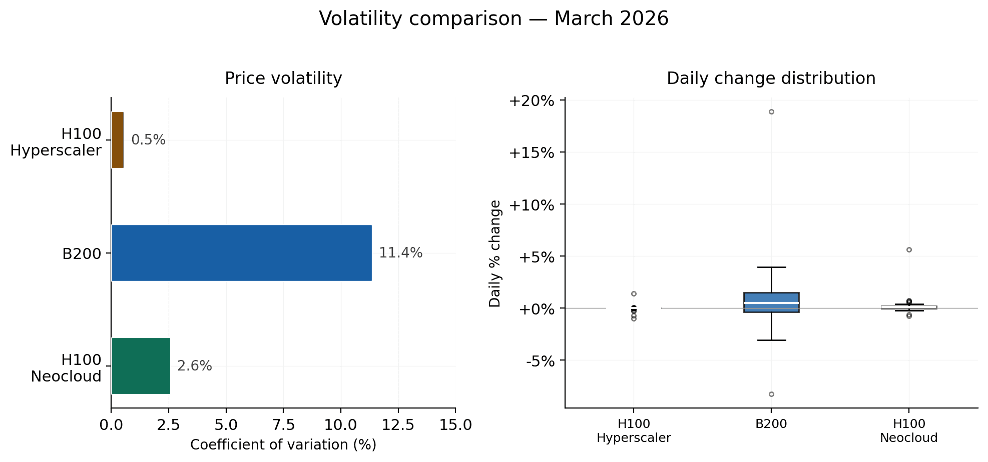
Exhibit. Price volatility comparison, coefficient of variation and daily change distribution.
The volatility picture confirms what the daily chart implied. B200's coefficient of variation (CV) was 11.4% in March — roughly 4x that of H100 Neocloud (2.6%) and more than 20x that of H100 Hyperscaler (0.5%). The daily change boxplot adds nuance: B200 posted a maximum single-day swing of 18.9%, with an average absolute daily change of 2.3%. H100 Hyperscaler and Neocloud, by contrast, rarely moved more than 1–2% on any given day.
This matters for buyers planning workloads. If you are committing to a multi-week training run on B200, the price you lock on day one could be materially different from the spot rate a week later. H100 pricing, on either tier, is far more predictable — you can quote a budget with confidence.
Track B200 Pricing in Real Time with Silicon Data
In a market where B200 rental prices can shift meaningfully within a single month—individual providers cutting rates by 34% or raising them by 16%—real-time intelligence isn’t a nice-to-have. It’s the difference between locking in a reserved rate at the right moment or overpaying for the same compute.
This update is built on Silicon Data's platform. The most relevant tools are SiliconNavigator for daily spot, on-demand, and reserved quote tracking across 50 GPU chipsets, SiliconIndex for standardized benchmarks such as SDB200RT, and SiliconPriceIQ for forward-looking price scenarios by chip, region, configuration, and rental term.
All three are available via API for enterprise workflows. For teams actively renting or evaluating B200 compute, the value is having live comparisons, historical context, and forecast support in one place so procurement decisions are grounded in both current conditions and recent trend shifts.
What is the SDB200RT index?
Why did B200 prices spike in March 2026?
Should I rent B200 or H100 for my workload?
Written by
Carmen Li
Founder at Silicon Data
Share this story
Articles you may like